Tremor
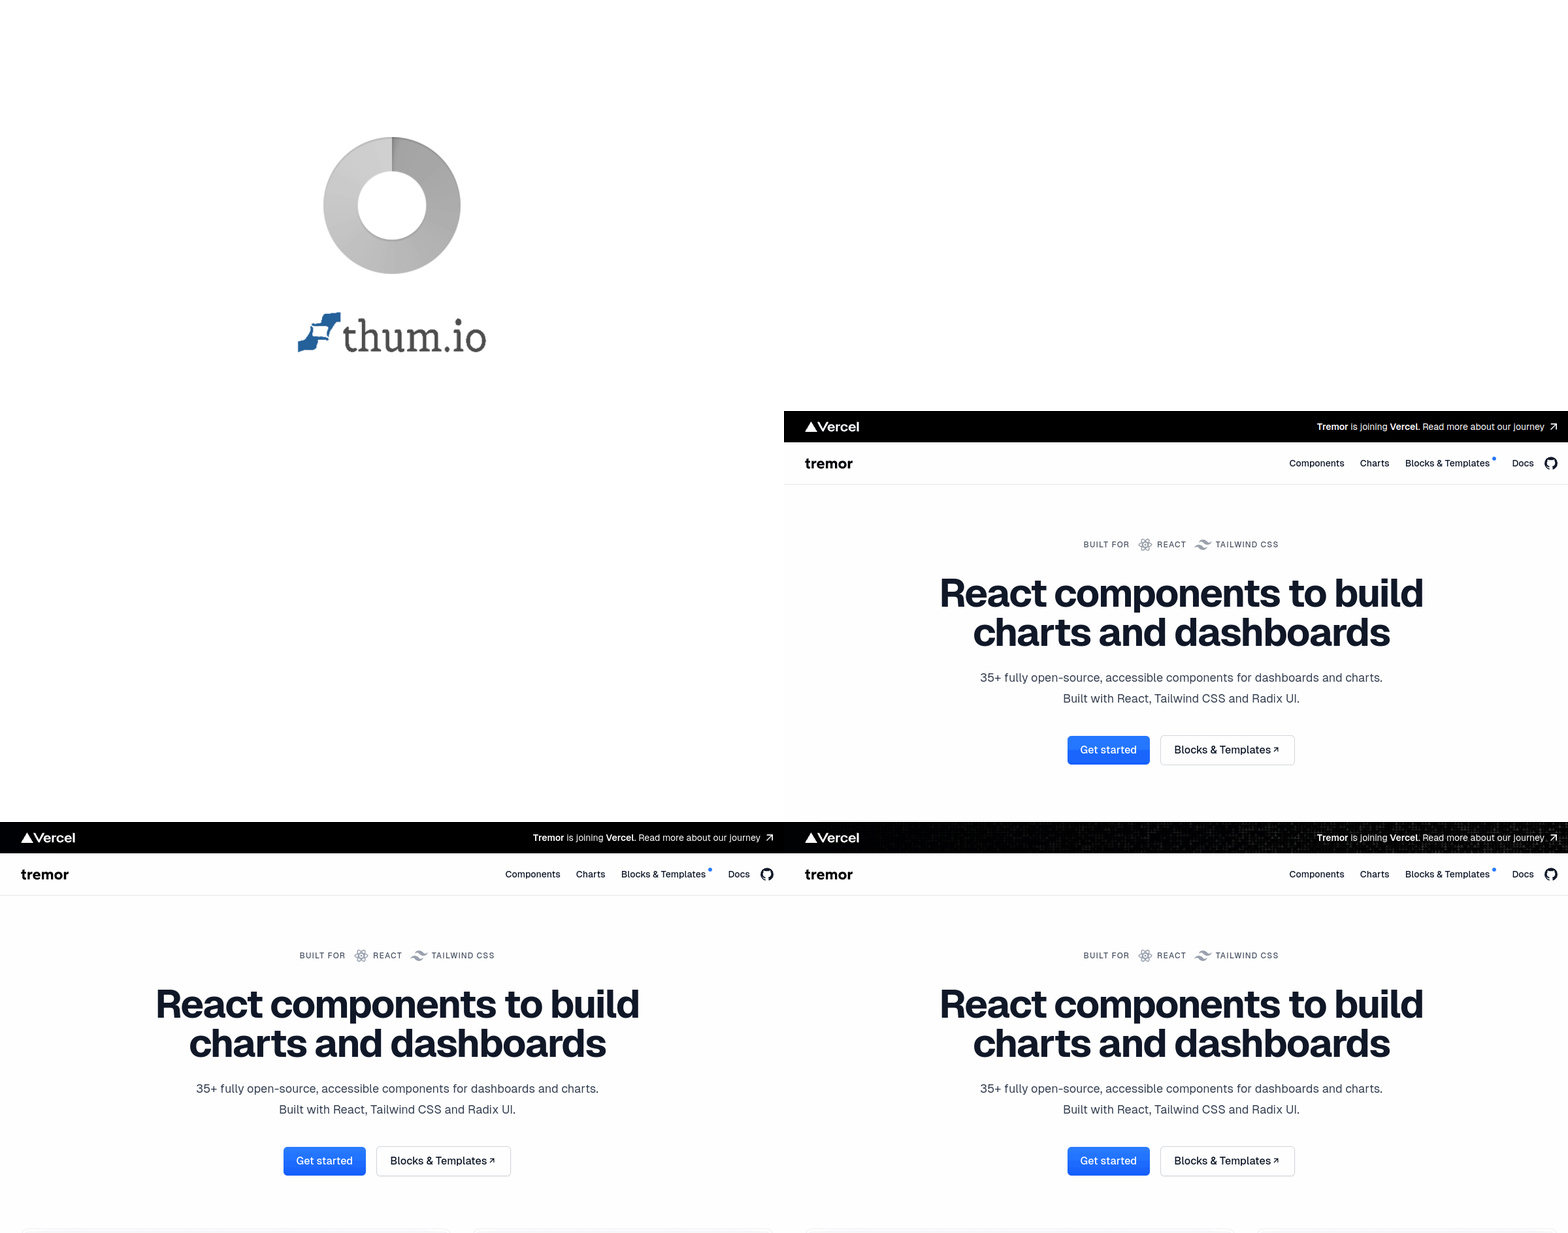
React components for analytics dashboards, charts and data-rich products.
Design notes
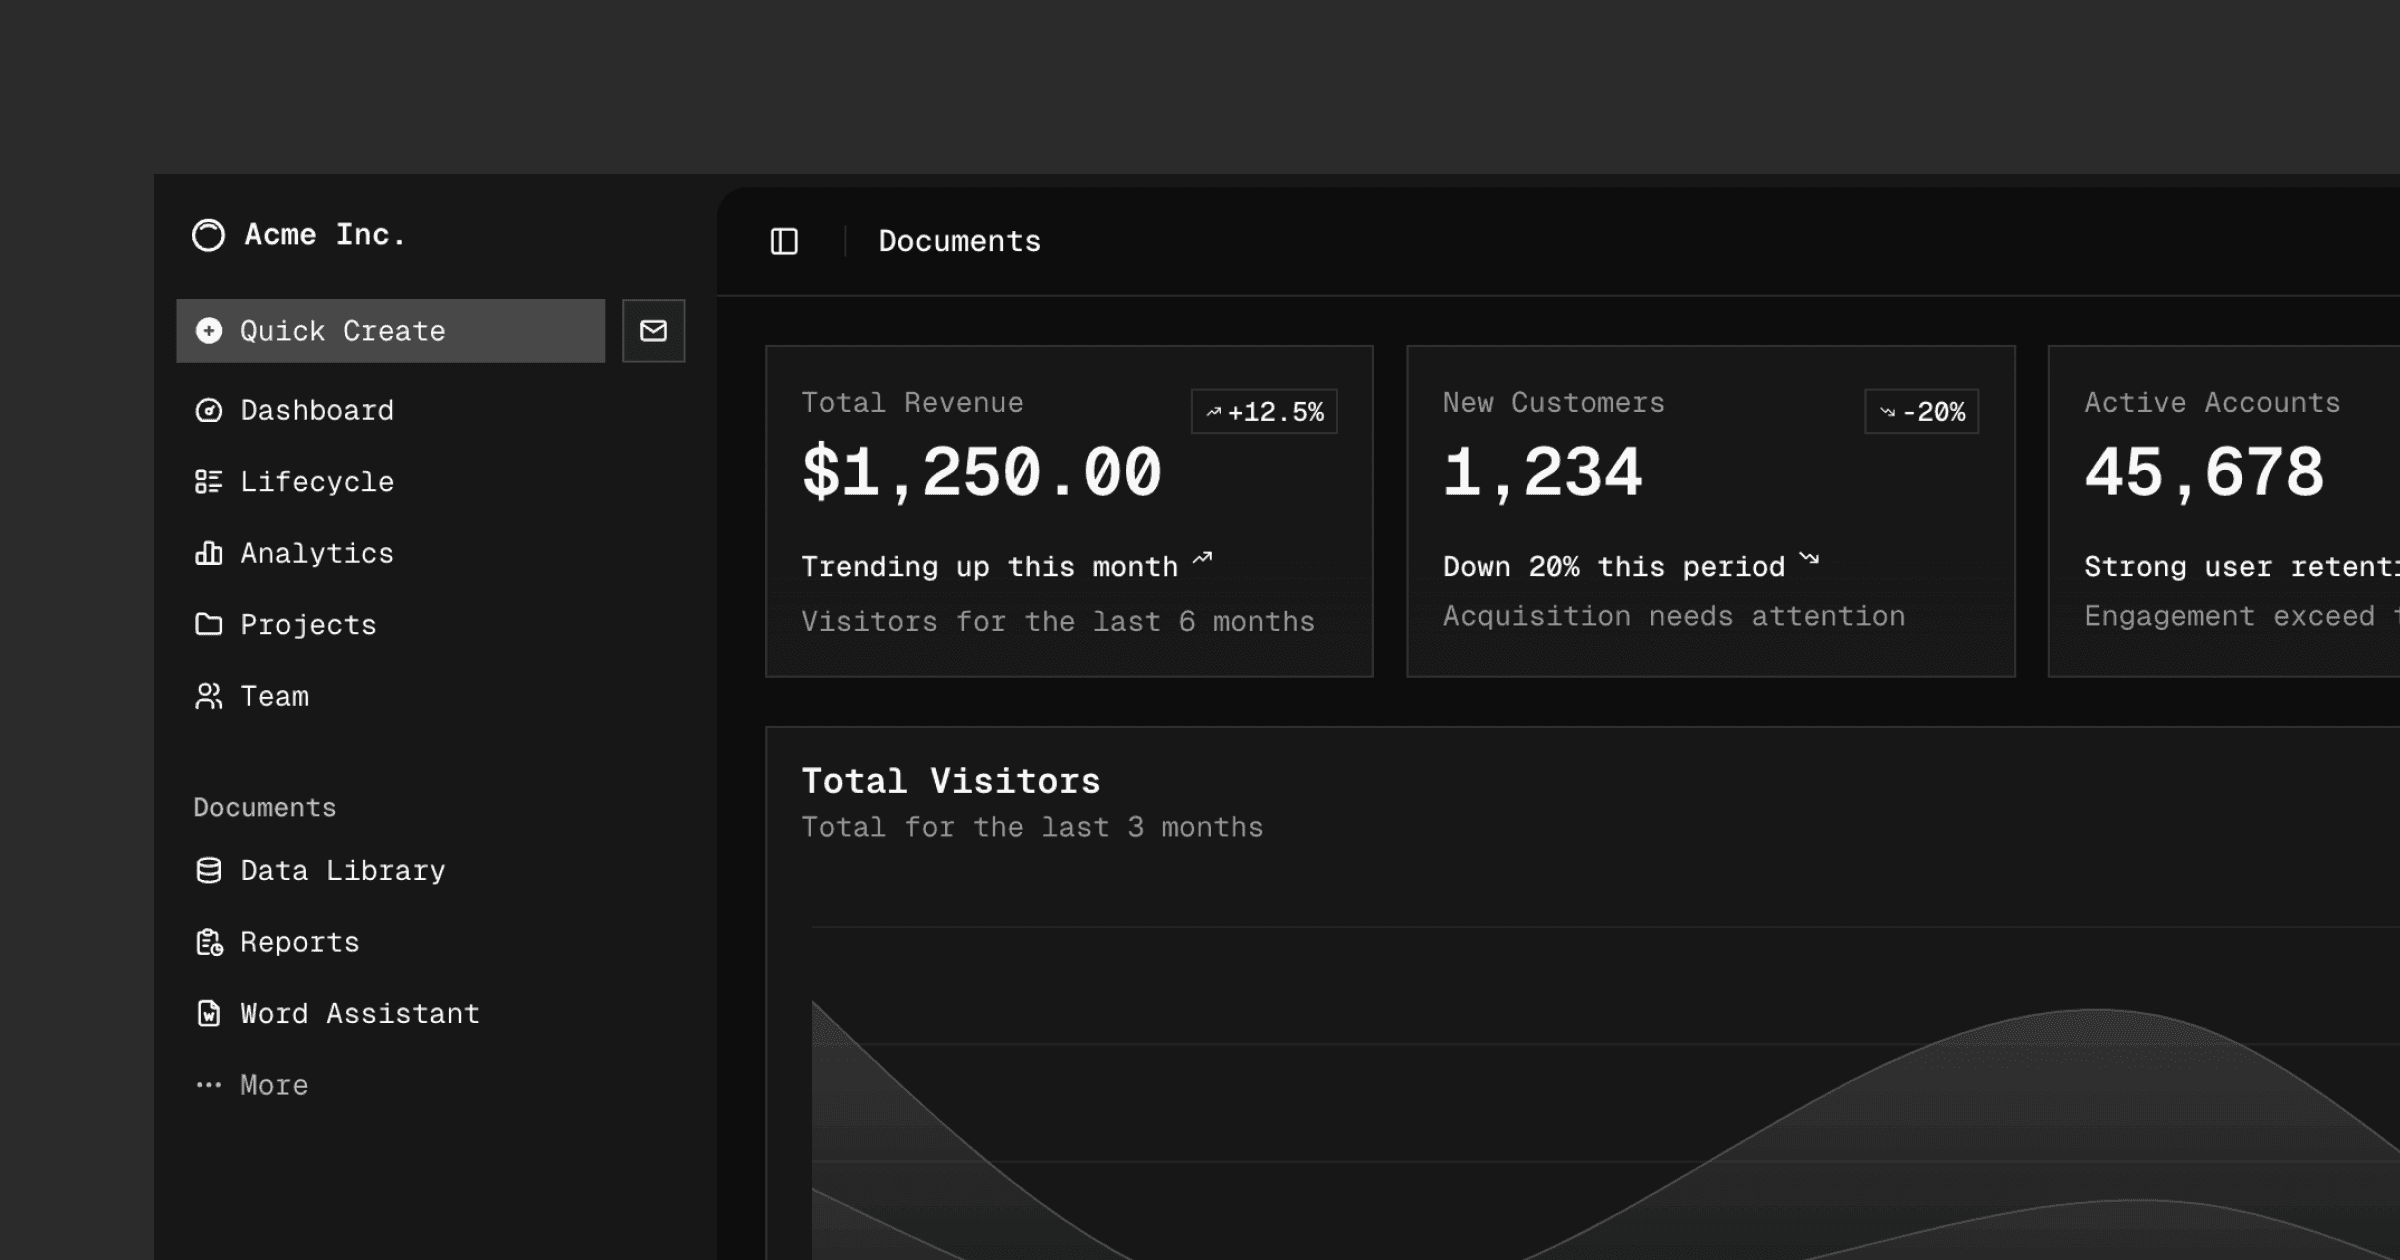
Tremor focuses on the building blocks of analytical interfaces, including charts, metrics, tables and dashboard layouts. It helps teams make complex data easier to scan and compare within a consistent visual system.
Its focused set of data-visualization patterns is useful when designing financial tools, reporting products and operational dashboards.